Let’s look at NVIDIA (NVDA) from two angles: fundamentals and technicals.
1. Fundamental view
Using the Graham valuation model as a practical tool, NVDA’s current fair value is around $197.
From history, a normal stock price usually moves 10–20% above or below its value:
• –10% to –20%: a healthy pullback or short-term undervaluation during sector rotation
• +10% to +20%: strong demand, momentum premium, and short-term speed-up
If we add a reasonable momentum premium:
197 × 1.20 ≈ $236
This means $236 can be seen as a reasonable upside level based on fundamentals in the current cycle.
2. Technical view
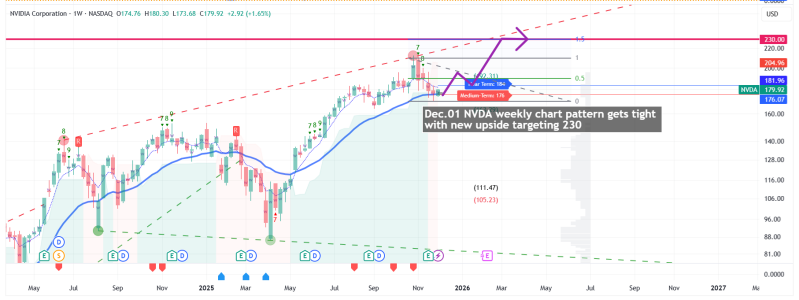
On the technical side, NVDA’s weekly chart is clearly tightening. This is a common pattern before a larger move. The key structure is a sideways range:
• Range: $169 – $212
Based on the 50% Fibonacci extension, the upside target is around $230+,
which closely matches the $236 level from the fundamental view.
When fundamentals and technicals point to the same price area, this kind of alignment is very meaningful.
That said, timing matters. Because this is a tightening weekly pattern, the daily chart may still move sideways for a few more days.
In simple terms
NVDA remains a core engine of the global AI cycle.
Its price structure, momentum, and industry logic all line up well.
The overall path is still clear and steady.
• Mid-term fundamental target: $236
• Mid-term technical breakout target: $230+
If you want, I can also break this down into a shorter trade plan or a risk view.
Add comment
Comments