On Jan. 20, VQF accurately identified QQQ 610 as a key demand zone and a dip-buy level.
Since then, the market has moved into a steady upward trend.
No matter what news or stories are in the market, the key is to follow the chart structure built by time cycles.
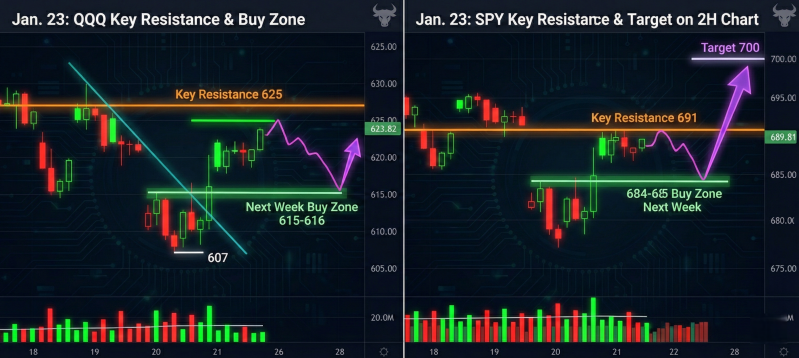
From the 2-hour chart, which shows the short-term big picture, the market may hit resistance today near:
• SPY 691
• QQQ 625
Many people ask: Will there still be a chance to retest QQQ 610?
My view is that a pullback next week to these areas is more likely and more reasonable:
• QQQ 615–616
• SPY 684–685
These zones could offer good opportunities for short-term trades.
From a structure point of view, this path makes more sense than a straight move up.
Stay with price action.
Key Levels Summary
• Today’s resistance:
• QQQ 625
• SPY 691
• Next week buy zones:
• QQQ 615–616
• SPY 684–685
Add comment
Comments